Graphing Water on Earth
Assessment
Shared by: Liz
0 Recommend
What is this task about?
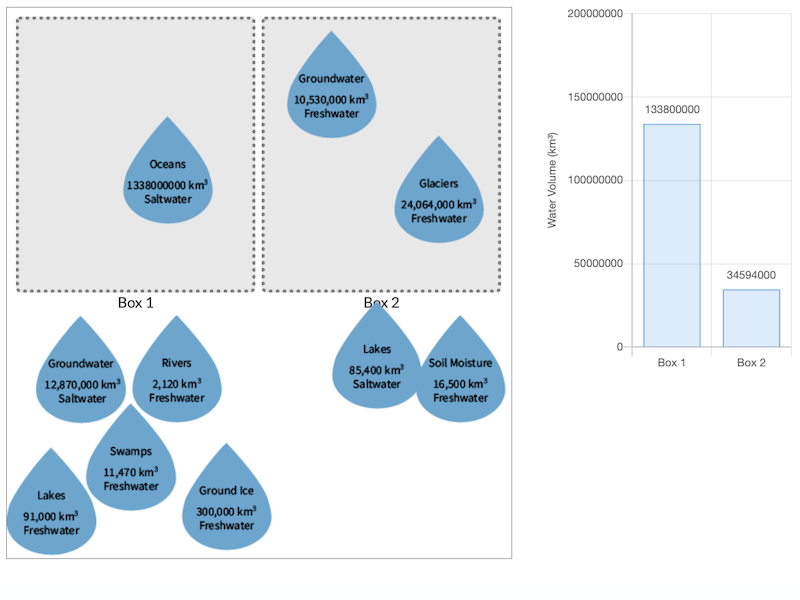
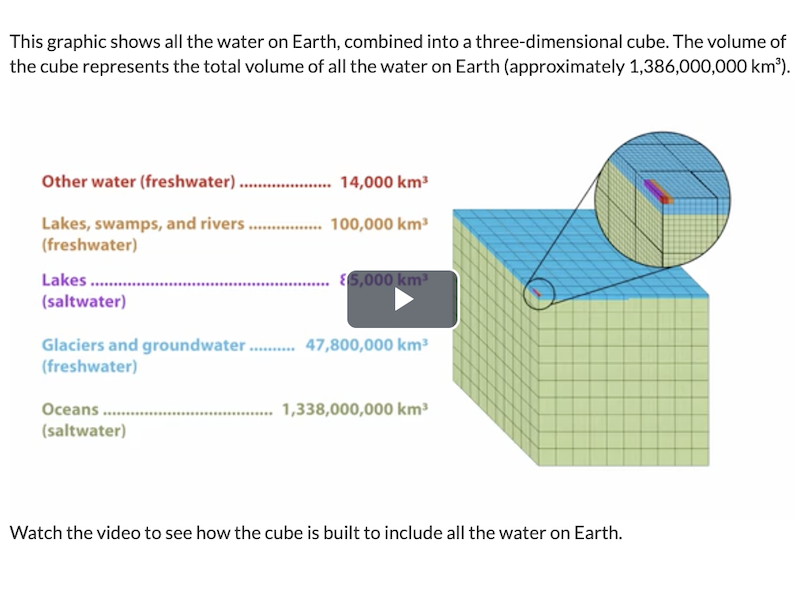
Students describe and generate charts to answer a scientific question on differences in volume between fresh water and salt water.
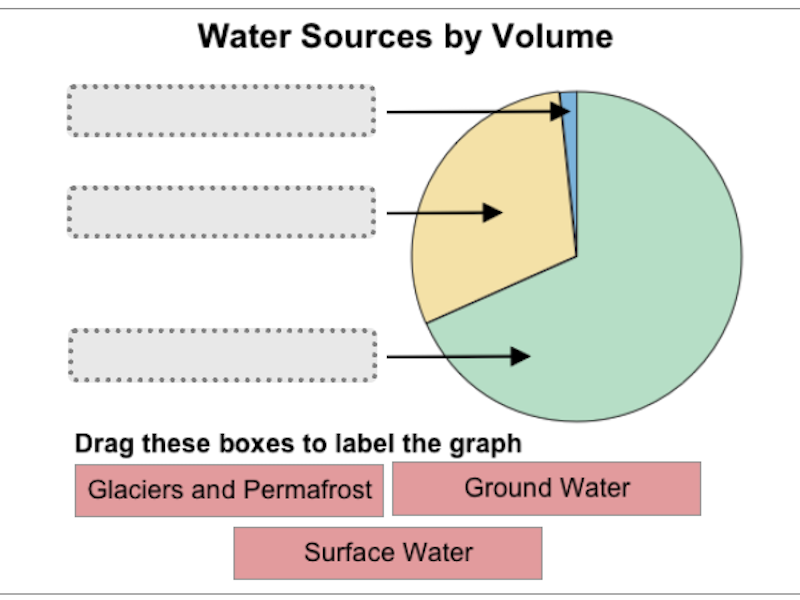
Students consider why a given graph, while accurate, does not provide the information needed to answer a specific question about the distribution fresh and salt water on Earth. They then create their own graph and describe why it is better for answering the question than the original graph.
The three dimensions of this task are
- DCI: ESS2.C: The roles of water in Earth’s surface processes
- SEP: Using Mathematics and Computational Thinking
- CCC: Scale, Proportion, and Quantity
See Everything you need to know about 5-ESS2-2 to learn more about this performance expectation.
Click on the tabs above to learn more about ways to use this task with your students, understand their responses, and what you can do next.
Implementation Options
When To Use
Before or During Instruction – Use this as part of your instruction about this content.
After Instruction – Assess what your students have learned about this content.
Pick a Paired Task!
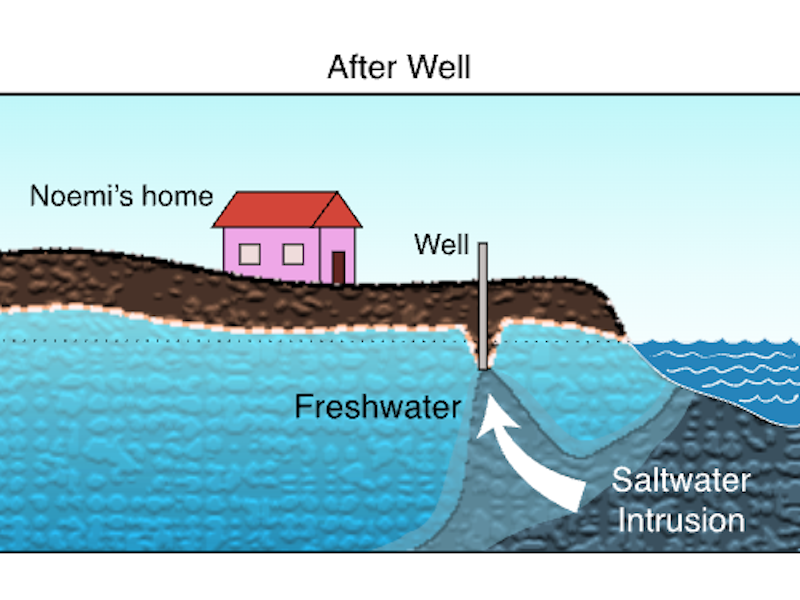
This task pairs well with Coastal Aquifers, another task developed for the same learning performance.
Alternatively, you might choose a task developed for a different learning performance, or one that uses a different SEP or CCC.
Other Recommended Pairings:
- Maya Moves to Los Angeles
- Water Supply from Shasta Lake
- Water Storage in Shasta Lake
- A Drop of Fresh Water and an Ocean of Salt Water
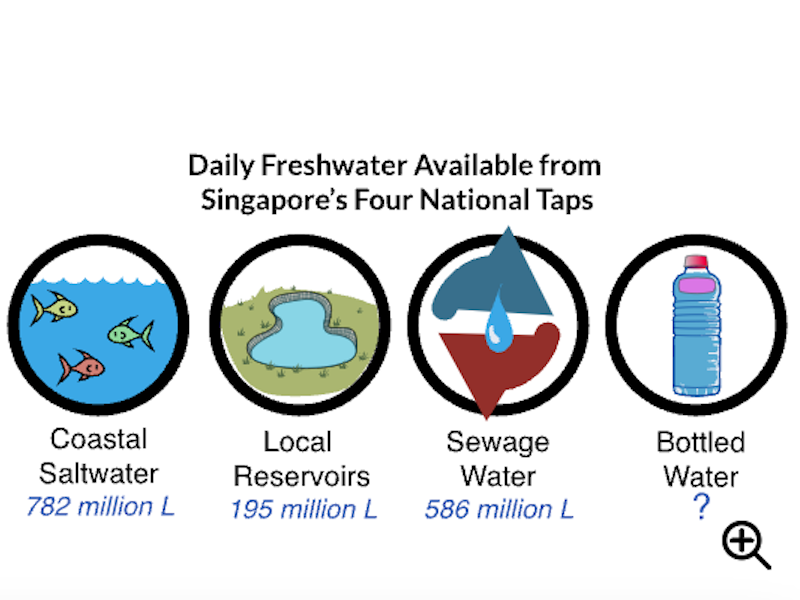
- Singapore's Four National Taps
Visit the Discussion Boards to talk about this task with other teachers.
